When we work with data in Excel, there are times when rows need to become columns and columns need to become rows; this is called transposing. While Excel provides a built-in TRANSPOSE function for ...
Sometimes we need to extract only the year component for a given date. We see this commonly in financial reports, trend analysis, and organizing datasets based on yearly values. Excel has a few very ...
When we are working with dates in Excel, it is a common task to compare two dates to determine if one is greater than the other. This is good in managing deadlines, tracking due dates, or automating ...
When we need to understand and visualize the distribution of a dataset, especially a large one, we use the histogram plot. Plotting a histogram allows us to group a large dataset into small intervals ...
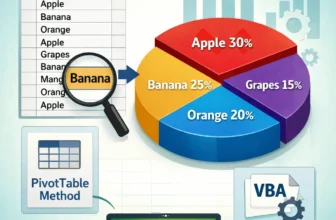
In Excel, our dataset typically contains multiple categories, and we need to compare them to extract relevant information. In such a situation, using a pie chart is very useful as it allows us to ...
When we work with datasets of various categories, we often need a quick visualization method to see how differently these values or categories are distributed. For this purpose, using a pie chart is ...
When analyzing data or using a formula in Excel, we sometimes need to copy and paste it into another cell. And, in many cases, our formula includes cell references that must remain unchanged. ...
In Excel, we often prepare different data-based reports for both business and academic purposes. However, if headers and footers clutter the layout of our report, they can easily distract the ...
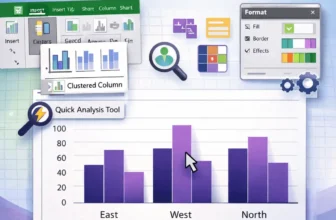
One of the most popular chart styles in Microsoft Excel is the clustered column chart, which is ideal for comparing results across several categories. For ease of comparison, vertical bars are ...