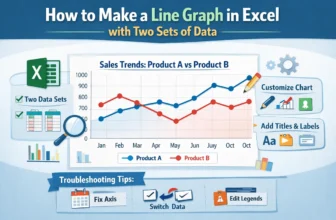
In most workplaces, the ability to display visual data for presentation is a highly required skill. In this case, Excel is one of the best tools that help people to make graphs, charts, and tables to ...
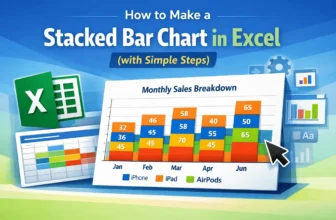
Creating a Stacked Bar Chart in Excel is an excellent way to display data when we want to show both the individual parts and the overall total in one view. Instead of listing numbers in a table, this ...
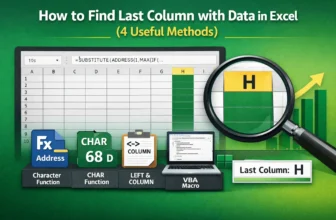
When working with large datasets, it is often necessary to identify the last column that contains data for accurate analysis and management. By using Excel's built-in tools and functions, we can ...
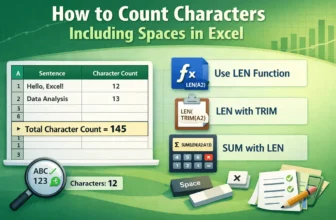
Counting characters, including spaces, in Excel is necessary for tasks such as analyzing text length, validating data entries, or ensuring values fit within predefined limits. By using Excel's ...
Converting hours to minutes in Excel is a common task for working with time-based datasets, such as employee work logs, project durations, or task management. By using Excel's built-in tools and ...
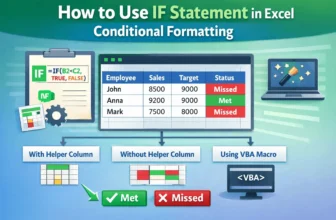
Combining the IF statement with Conditional Formatting in Excel allows users to create dynamic rules that automatically highlight cells based on logical conditions. With Excel’s built-in tools and ...
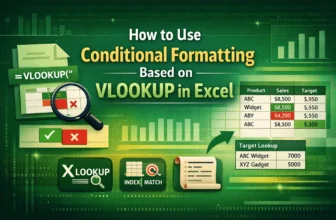
Combining Conditional Formatting with VLOOKUP function lets users dynamically highlight cells based on lookup results, making it easier to visually track matches. By using Excel’s built-in tools and ...
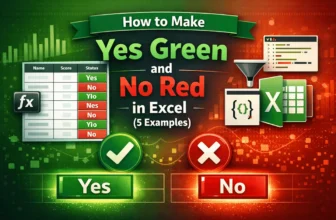
Highlighting “Yes” and “No” in Excel with different colours helps make datasets more readable and visually appealing. It is especially helpful for displaying datasets with repetitive values, where ...
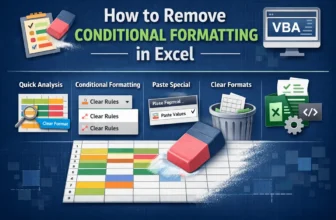
Conditional Formatting is a powerful Excel feature that highlights cells based on specific rules, making patterns and trends easier to spot. However, excessive formatting can clutter the worksheet ...