The error bar is the measurement of the accuracy of a data point. A standard deviation error bar in Excel shows the data point deviations from the mean/average.
In other words, the standard deviation error bars are error bars with standard deviation values.
To add standard deviation error bars in Excel:
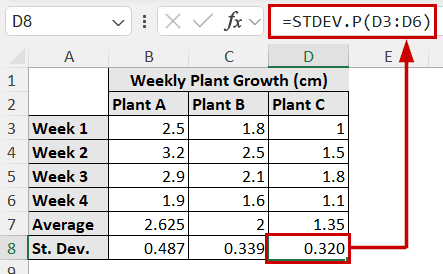
➤ Calculate the standard deviation value of each series using the STDEV.P function.
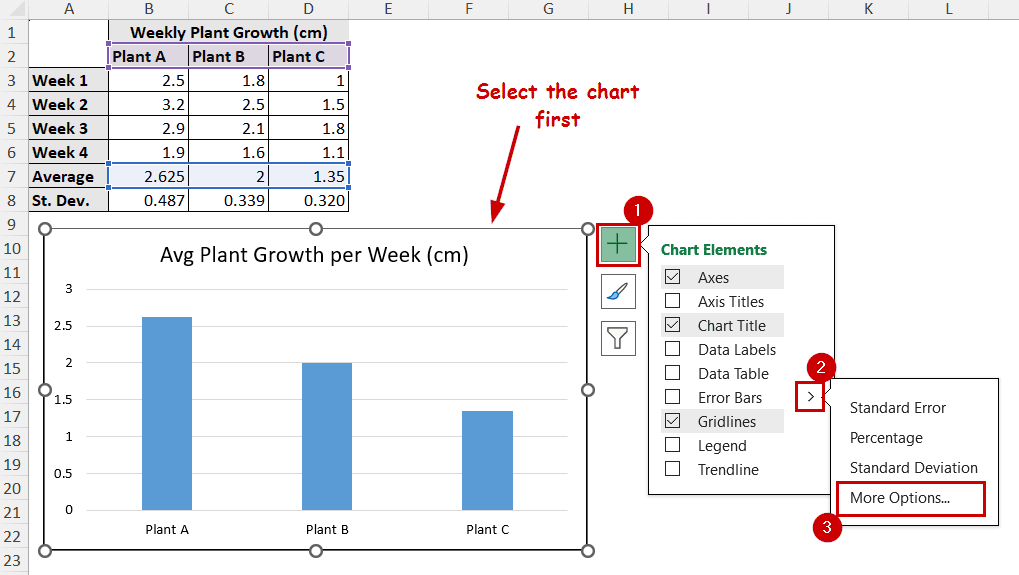
➤ Select the chart and select Chart Elements >> Error Bars >> More Options.
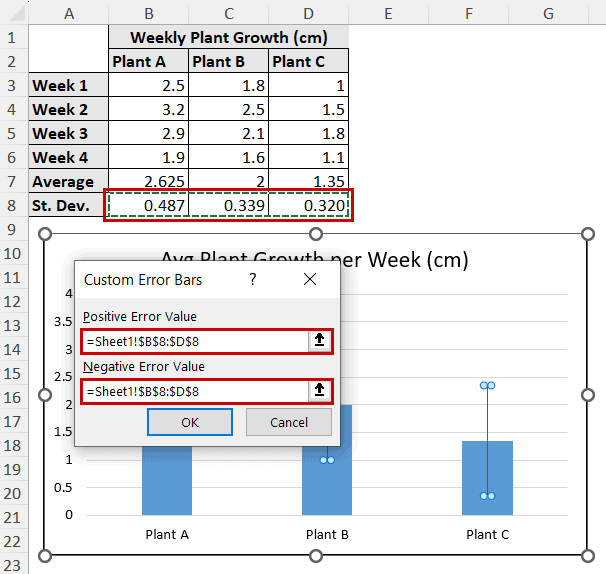
➤ Select Custom and Specify Value in the Error Bar Options of the Format Error Bars pane.
➤ Insert the calculated standard deviation values in the positive and negative fields of the Custom Error Bars dialog box.
In this tutorial, we will go through why we use standard deviation error bars, the general problem of adding the standard deviation error bar directly in Excel, and how to add them properly.
Download Practice WorkbookWhat Does Standard Deviation Error Bar Mean?
Standard deviation is an indication of how sample data is spread around its mean. There are some advantages of choosing standard deviation error bars over other error bars:
- It shows how much a data point can differ from the average.
- The overlapping of standard deviation error bars between two points indicates whether or not a difference is significant.
- No overlap indicates a significant difference.
- Less overlapping indicates a small difference.
- High overlap indicates no statistical difference.
- It gives an idea about the consistency of the data.
Problem with Adding Standard Error Bars
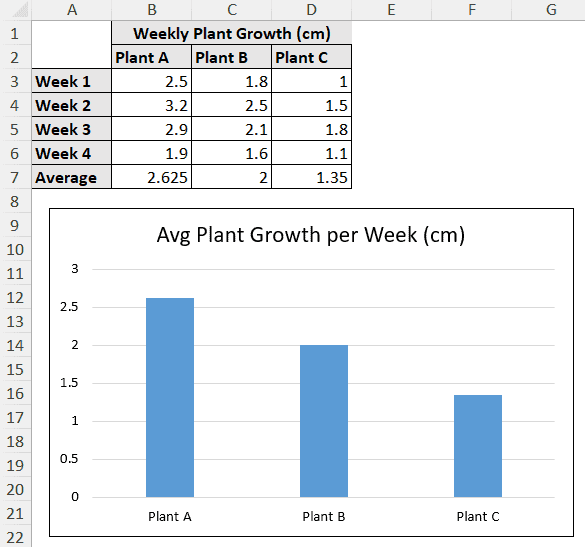
Let’s take a sample data of three plants’ growth across four weeks. The chart shows the average of each plant in different columns.
There is a standard deviation option in Chart Elements >> Error Bars >> Standard Deviation.
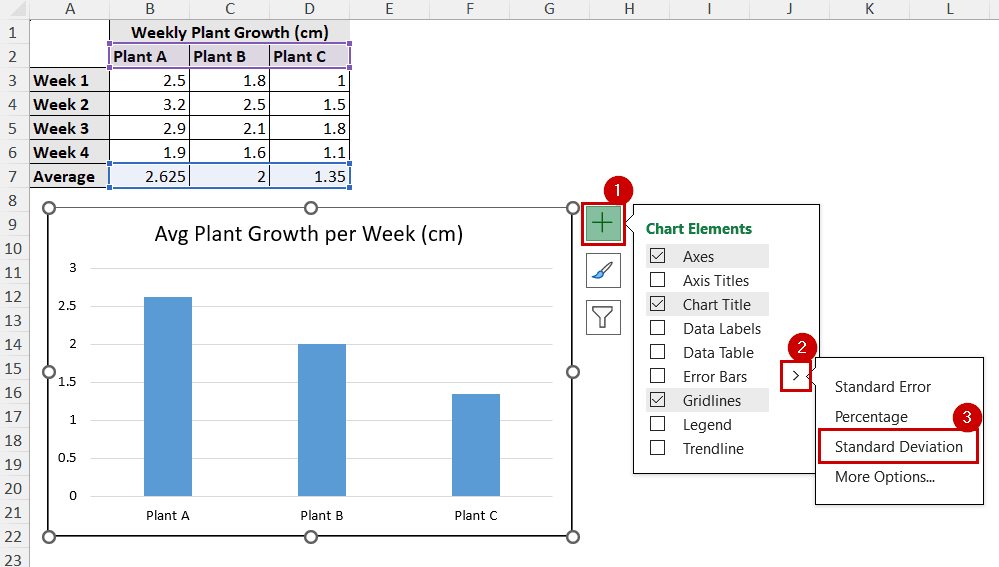
If we insert error bars from there, it looks something like this:
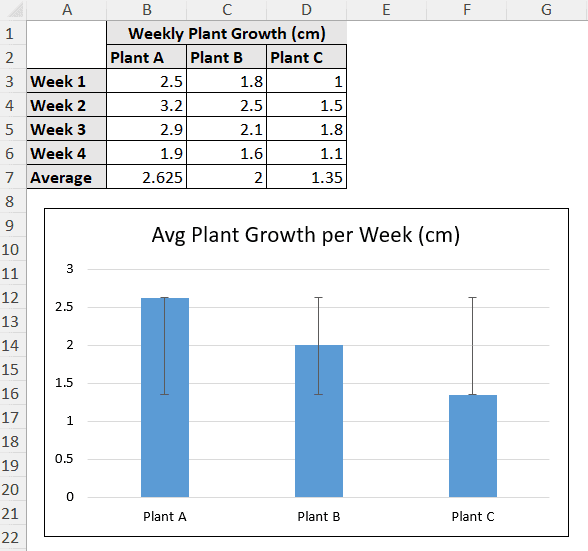
This happens because Excel calculates the standard deviation from the whole sample. Then it plots the same amount for all the columns.
Hence, this method doesn’t give an accurate idea for all series.
How to Add Standard Deviation Error Bars in Excel
To correctly add standard deviation error bars in Excel, we need to add standard deviation as custom error bar values. We can access the customizing options of error bars in the Format Error Bars pane.
Steps:
➤ First, calculate the standard deviation for each series. Excel has the STDEV.P function to calculate the standard deviation.
➤ Select the chart and go to Chart Elements >> Error Bars >> More Options.
➤ Under the Error Bar Options, select Custom and click on the Specify Value button.
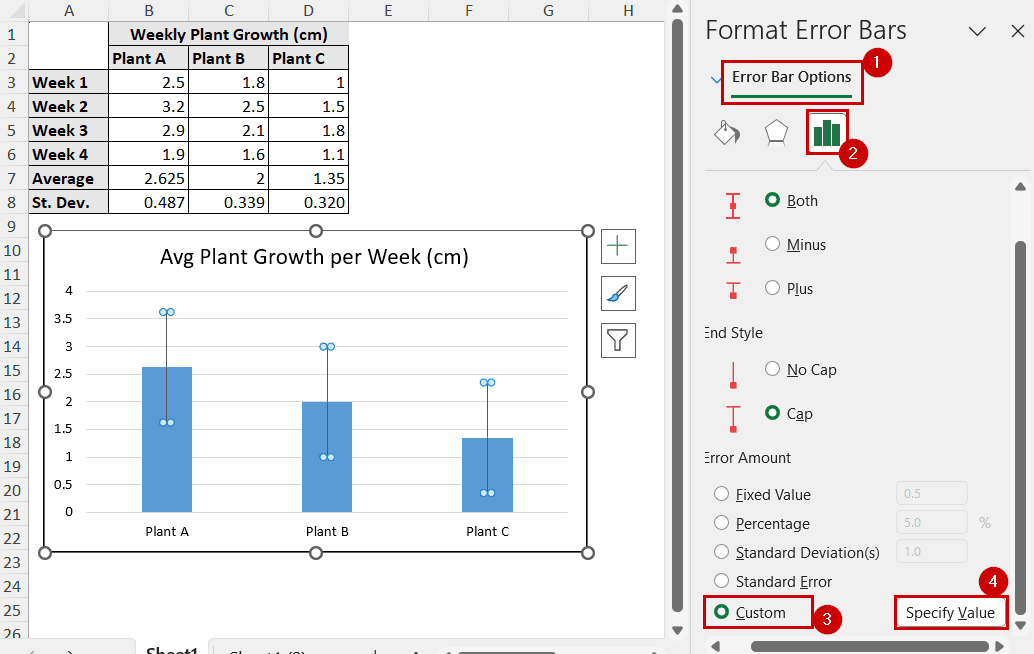
➤ Insert the calculated standard deviation values in the positive and negative fields of the Custom Error Bars dialog box.
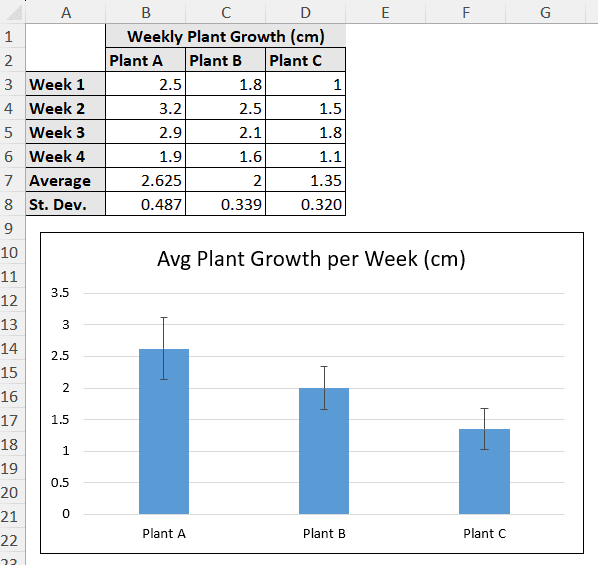
➤ Click on OK.
The standard deviation error bars will properly display on the chart now.
FAQ
What is the difference between SD and SEM error bars?
SEM (Standard Error of Mean) or SE (Standard Error) is the measurement of uncertainty of the mean in the sample. Meanwhile, the SD (Standard Deviation) indicates the spread of the sample around the mean.
So, the SEM error bars contain the uncertainty values, and the SEM error bars contain the dispersion values.
How do I add standard deviation error bars to a histogram in Excel?
You can’t add standard deviation error bars to a histogram in Excel. Because the histogram doesn’t support any form of error bar.
Some of the charts that support error bars are bar, column, 2-D area, line, xy(scatter), and bubble charts.
Conclusion
In this tutorial, we have covered what is a standard deviation error bar, why use them over other types of error bars, the problem with adding standard deviation error bars in Excel, and how to add them properly.
Feel free to download the practice workbook and give us your feedback.