Managing significant figures in Excel is essential when working with precise data whether you’re handling scientific measurements, engineering calculations, or financial reports. Accurate control over significant figures ensures your results are both professional and reliable.
In this article, we’ll explore all the effective methods to change significant figures in Excel. You’ll learn how to round numbers with functions like ROUND, ROUNDUP, and ROUNDDOWN, format cells for display precision, apply conditional formatting, use advanced formulas, and even create a custom VBA function for maximum flexibility. Let’s get started.
Steps to change significant figures in Excel:
➤ Click the cell where you’d like the rounded value to be displayed.
➤ Type this formula to round the number in A2 to one decimal places: =ROUND(A2,1)
➤ Press Enter, then drag or copy the formula down your dataset to apply the rounding to all relevant values.

Use ROUND Function to Adjust Significant Figures
The ROUND function is one of the most reliable and straightforward tools in Excel for managing significant figures when you need quick adjustments. Even though ROUND doesn’t directly target significant figures, it allows you to approximate them by setting a specific number of decimal places. This makes it ideal for financial statements, engineering data, and lab results where clarity and readability are essential.
We’ll use the following dataset:

Steps:
➤ Click the cell where you’d like the rounded value to be displayed.
➤ Type this formula to round the number in A2 to one decimal places:
=ROUND(A2,1)
➤ Press Enter, then drag or copy the formula down your dataset to apply the rounding to all relevant values.

Use this method when you want to keep the process simple and only need consistent decimal places across your worksheet.
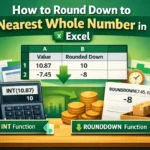
Use ROUNDUP or ROUNDDOWN for Directional Rounding
Sometimes precision isn’t just about the number of decimal places, it’s about controlling the direction of rounding. Excel’s ROUNDUP and ROUNDDOWN functions let you decide whether values should always move upward or downward, regardless of their fractional part. This is especially valuable for financial data, inventory tracking, or engineering calculations where even small rounding differences could affect totals, budgets, or measurements.
Steps:
➤ Select an empty cell adjacent to the value you want to adjust.
➤ Enter to round up to one decimal places:
=ROUNDUP(A2,1)

➤ Alternatively, use this formula to round down:
=ROUNDDOWN(A2,1)
➤ Press Enter and drag or copy the formula down your column to apply directional rounding to all relevant values.

Apply this approach when exact upward or downward adjustments are crucial for your analysis or reporting needs.
Format Cells for Display-Only Significant Figures
There are times when you need to control how your numbers look without changing their actual values, for example, in scientific reports, presentations, or financial dashboards where consistency matters visually but calculations must remain precise. Excel’s Format Cells feature is perfect for this. It adjusts the displayed decimal places or significant figures while leaving the underlying numbers untouched, ensuring your formulas and calculations remain accurate.
Steps:
➤ Highlight the range of cells containing the values you want to format.

➤ Press Ctrl + 1 to open the Format Cells tab.
➤ In the Format Cells dialog box, go to the Number tab.
➤ Choose Number or Scientific from the category list depending on your needs.
➤ Specify the desired number of decimal places for display and click OK to apply.

Your output will display instantly.

Highlight Values with Conditional Formatting Based on Significant Figures
When analyzing complex datasets, spotting values that don’t conform to your significant figures standards can be time-consuming. Conditional Formatting in Excel provides a powerful visual cue by automatically highlighting values that exceed or fall short of your desired precision. While Excel doesn’t directly calculate significant figures, you can cleverly approximate them using formulas based on decimals or text length. T
Steps:
➤ Select the entire range of values you want to evaluate.
➤ Go to Home >> Conditional Formatting >> New Rule to create a custom rule.

➤ Choose Use a formula to determine which cells to format from the options.
➤ Enter a formula to flag numbers with too many significant digits:
=LEN(TEXT(A2,"0.000"))>6
➤ Click Format, pick a standout highlight color or style, and click OK to apply the rule.

➤ Instantly view which values don’t meet your desired significant figures criteria without altering the underlying data.

Use a Formula to Round to N Significant Figures
For tasks requiring true significant figure rounding, Excel doesn’t offer a built-in function—but you can achieve it using a clever combination of ROUND, LOG10, and ABS. This advanced formula automatically calculates where the most significant digit occurs, then rounds to the specified number of significant figures. It’s especially valuable for scientific, financial, or engineering data where precision and consistency across vastly different magnitudes are critical.
Steps:
➤ Use the formula:
=ROUND(A2, 3-(1+INT(LOG10(ABS(A2)))))
➤ Replace A2 with the cell containing your value, and change 3 to the number of significant figures you need.
➤ Press Enter to apply the rounding for a single value.
➤ Drag or copy the formula down your column to apply it across the entire dataset.

Rely on this approach when you need consistent precision for values with widely varying scales.
Create a Custom VBA Function for Flexible Significant Figures
When you’re working with large datasets or repetitive tasks, built-in Excel functions might feel restrictive. Creating a custom VBA function gives you full control over significant figure rounding and saves time by automating the process. With a small VBA script, you can specify both the value and the number of significant figures, then apply it across your worksheet just like any standard Excel function.
Steps:
➤ Press Alt + F11 to open the VBA editor.
➤ Navigate to Insert >> Module and paste the following code:
Function RoundSF(val As Double, sf As Integer) As Double
    RoundSF = Round(val, sf - Int(Log(Abs(val)) / Log(10)) - 1)
End Function
➤ Press F5 to run the code or simply close the VBA editor after saving.
➤ Back in your Excel sheet, use the formula to round the value in A2 to 4 significant figures.
=RoundSF(A2,4)
➤ Drag the formula down to apply consistent rounding across your entire dataset.

Frequently Asked Questions
What is the difference between rounding and changing significant figures?
Rounding adjusts decimal places, while significant figures focus on meaningful digits in a value. Significant figures account for magnitude, ensuring precision for scientific or engineering data, whereas rounding may simply truncate or extend decimals.
Can formatting cells change the actual stored value in Excel?
No, formatting cells only alters how numbers appear, not their stored values. Excel keeps the original precision intact. Use ROUND, ROUNDUP, or formulas if you need to permanently modify the underlying values instead of just formatting.
When should I use Scientific format for significant figures?
Scientific format is ideal for very large or small numbers, ensuring consistent significant figures across datasets. It maintains clarity for values spanning wide ranges, such as engineering measurements, chemical concentrations, or astronomical calculations requiring precise notation.
Why does Excel not have a built-in significant figures function?
Excel focuses on decimal rounding rather than scientific precision. Significant figures can still be achieved using formulas, formatting, or VBA. Microsoft designed Excel primarily for general calculations, so advanced rounding must be implemented manually through workarounds.
Can I use VBA to automate significant figure rounding for large datasets?
Yes, VBA can automate rounding to significant figures efficiently. By creating a custom function like RoundSF, you can apply consistent precision to large datasets, saving time compared to manually applying formulas or formatting repeatedly.
Wrapping Up
In this tutorial, you learned all the reliable methods to change significant figures in Excel, from ROUND functions and cell formatting to advanced formulas, conditional formatting, and VBA. With these techniques, you can manage precision effectively for scientific, financial, or engineering data. Feel free to download the practice file and share your feedback.